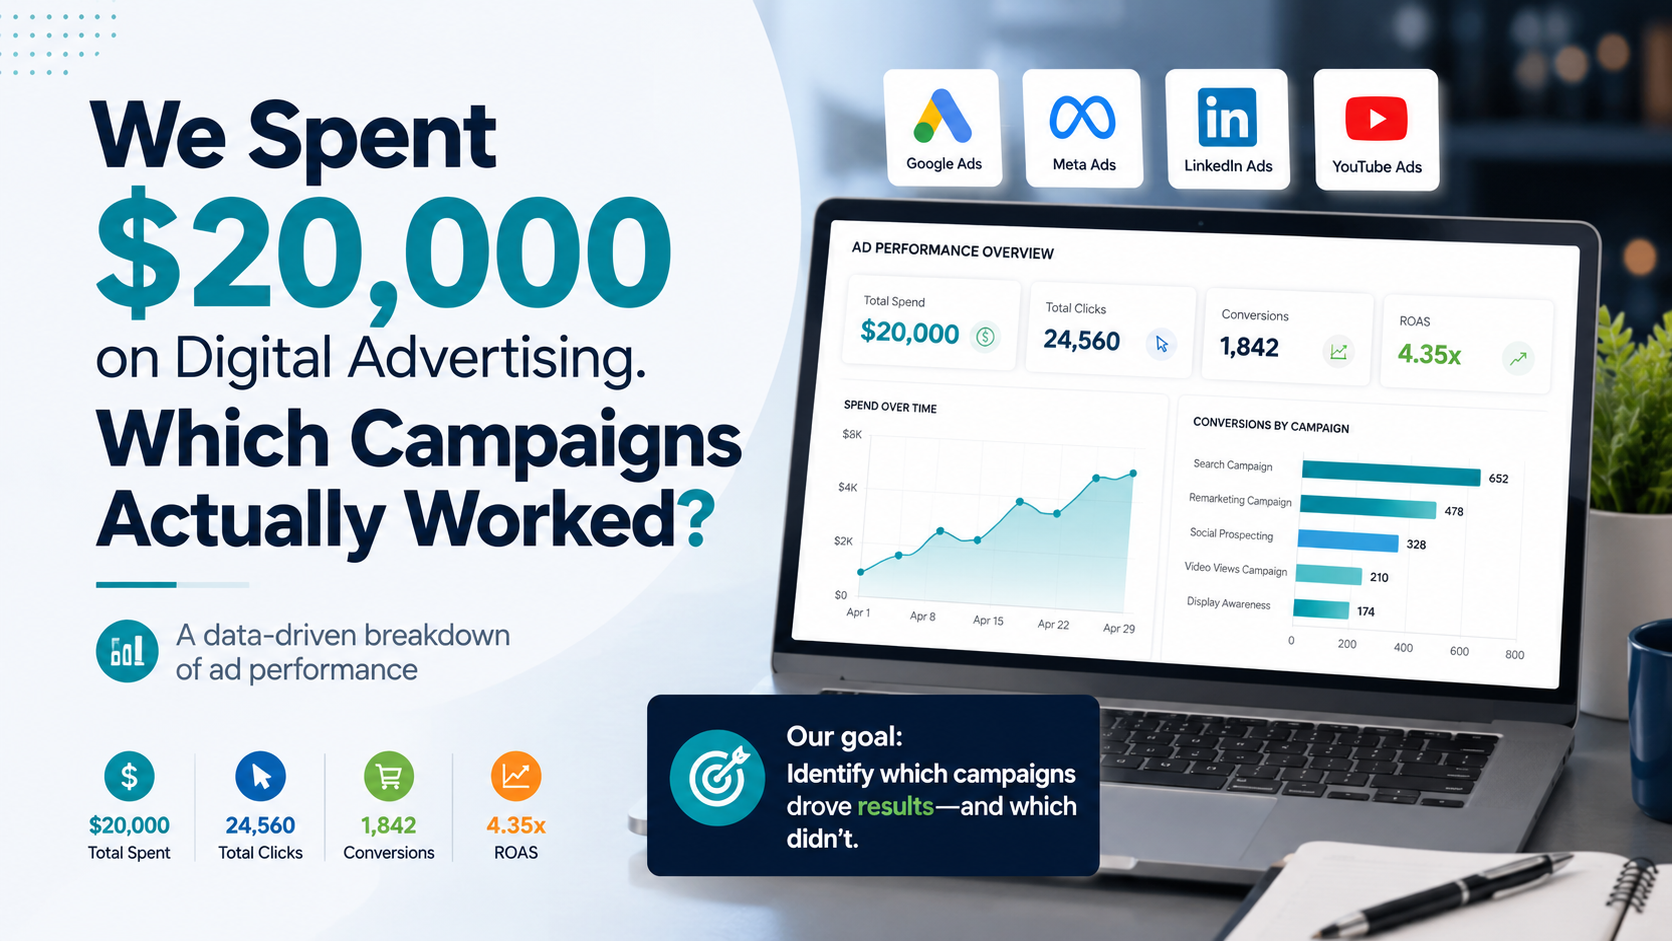
A campaign can generate thousands of clicks and still waste money. This article explains how marketing analysts connect advertising spend, leads, customers, and revenue to determine which campaigns worked and how the next marketing budget should be allocated.
We Spent $20,000 on Digital Advertising. Which Campaigns Actually Worked?
A company recently spent $20,000 on digital advertising. The marketing team reported thousands of impressions, website visits, clicks, and leads. Every platform showed colorful dashboards and positive-looking numbers. But the business owner asked a much more important question: “Which campaigns actually worked, which ones wasted money, and where should we spend next month’s budget?” This is the type of question marketing analytics is designed to answer. Running advertisements is only one part of marketing. The more valuable skill is understanding what happened after the advertisements were launched and turning that information into a clear business decision.
The Problem With Looking at Clicks Alone
Many campaign reports focus on metrics such as impressions, reach, clicks, click-through rate, and cost per click. These metrics are useful because they show whether people noticed and interacted with an advertisement. However, they do not tell us whether the campaign generated valuable business results. A campaign can receive many clicks because the advertisement is interesting, but those visitors may never submit an enquiry or purchase anything. Another campaign may receive fewer clicks but attract people who are much more likely to become customers. That is why campaign performance should not be judged by one metric alone.
A Simple Campaign Scenario
Suppose a company divided its $20,000 advertising budget across three campaigns. The Meta Lead Generation campaign received $8,000. It generated 2,400 clicks, 240 leads, 24 customers, and $28,800 in revenue. The Google Search campaign received $7,000. It generated 1,400 clicks, 175 leads, 35 customers, and $49,000 in revenue. The Display Advertising campaign received $5,000. It generated 2,500 clicks, 100 leads, 5 customers, and $6,000 in revenue. At first glance, Display Advertising appears successful because it generated the highest number of clicks. But clicks are only the beginning of the customer journey. To understand which campaign truly worked, we need to connect advertising activity with leads, customers, and revenue.
Step 1: Calculate Cost per Click
Cost per click tells us how much the company paid for each website visit generated by an advertisement. Cost per click = Advertising spend ÷ Number of clicks. For Meta Lead Generation, the company spent $8,000 and received 2,400 clicks. The cost per click was approximately $3.33. For Google Search, the company spent $7,000 and received 1,400 clicks. The cost per click was $5.00. For Display Advertising, the company spent $5,000 and received 2,500 clicks. The cost per click was $2.00. Display Advertising produced the cheapest clicks. Does that make it the best campaign? Not necessarily. A cheap click is valuable only when the visitor takes a meaningful action.
Step 2: Calculate Cost per Lead
Cost per lead shows how much the company spent to generate one potential customer. Cost per lead = Advertising spend ÷ Number of leads. Meta Lead Generation produced leads at approximately $33.33 per lead. Google Search produced leads at $40 per lead. Display Advertising produced leads at $50 per lead. Meta generated leads at the lowest cost. At this stage, Meta appears to be performing better than Google Search. However, not every lead has the same value. Some leads may be highly interested, while others may submit a form and never respond again. We must therefore examine how many leads became paying customers.
Step 3: Evaluate Lead Quality
Lead-to-customer conversion rate shows the percentage of leads that eventually purchased. Lead-to-customer conversion rate = Customers ÷ Leads × 100. Meta converted 24 customers from 240 leads, giving it a conversion rate of 10%. Google Search converted 35 customers from 175 leads, giving it a conversion rate of 20%.
Display Advertising converted 5 customers from 100 leads, giving it a conversion rate of 5%. Google Search converted leads into customers at twice the rate of Meta.
This suggests that Google Search attracted people with stronger purchase intent. Someone searching for a product or service on Google may already be actively looking for a solution. A person scrolling through social media may be interested, but not yet ready to purchase. This is why lead volume should always be evaluated alongside lead quality.
Step 4: Calculate Customer Acquisition Cost
Customer acquisition cost tells us how much advertising money was required to acquire one paying customer. Customer acquisition cost = Advertising spend ÷ Number of customers. Meta spent approximately $333.33 to acquire each customer. Google Search spent $200 to acquire each customer. Display Advertising spent $1,000 to acquire each customer. Google Search produced the lowest customer acquisition cost.Although its clicks and leads were more expensive, those leads were much more likely to become customers. Display Advertising produced cheap traffic but very expensive customers. This is a good example of why optimizing only for
clicks can lead to the wrong business decision.
Step 5: Connect Campaigns to Revenue
The most important step is determining how much revenue each campaign generated compared with its advertising cost. Return on ad spend, commonly called ROAS, measures the revenue generated for every dollar spent on advertising. ROAS = Revenue ÷ Advertising spend Meta generated $28,800 in revenue from an $8,000 budget. Its ROAS was 3.6, meaning it produced $3.60 in revenue for every $1 spent. Google Search generated $49,000 in revenue from a $7,000 budget. Its ROAS was 7.0, meaning it produced $7 in revenue for every $1 spent. Display Advertising generated $6,000 in revenue from a $5,000 budget. Its ROAS was 1.2, meaning it produced only $1.20 in revenue for every $1 spent. Once product costs, employee costs, software expenses, and other operating costs are considered, the Display campaign may not be profitable at all.
Which Campaign Worked Best?
Google Search was the strongest campaign. Google Search generated the most customers, the highest revenue, the lowest customer acquisition cost, the highest lead-to-customer conversion rate, and the strongest return on ad spend. It did not produce the cheapest clicks or leads, but it produced the most valuable business results. Meta Lead Generation performed reasonably well. Meta generated the highest number of leads and maintained a positive return. However, its lead-to-customer conversion rate was lower than Google Search. This campaign should not necessarily be reduced immediately. Instead, the company should investigate whether better audience targeting, lead qualification, follow-up communication, or landing-page improvements could increase conversions.
Display Advertising underperformed
Display generated the most clicks and the lowest cost per click. However, it also produced the fewest customers, the highest customer acquisition cost, the lowest conversion rate, and the weakest return on ad spend. The campaign was successful at attracting traffic but unsuccessful at converting that traffic into business results.
How Should Next Month’s Budget Be Divided?
The company should not simply move the entire budget to Google Search. Campaign performance can change as spending increases. A campaign that performs well with a $7,000 budget may become less efficient if its budget is suddenly doubled. A more responsible recommendation would be to reallocate the budget gradually.
Google Search could receive $10,000, increasing its budget from $7,000 because it generated the strongest customer and revenue performance. Meta Lead Generation could continue with $8,000 while the company tests better targeting, lead qualification, and follow-up strategies. Display Advertising could be reduced from $5,000 to $2,000 and used mainly for retargeting, brand awareness, or controlled testing. The total monthly advertising budget would remain $20,000. This approach shifts more money toward the strongest campaign without completely stopping experimentation.
What I Would Investigate Before Making the Final Decision
The calculations provide an important starting point, but a complete marketing analysis should go deeper. Profit margin. Revenue is not the same as profit.
If one campaign generates sales for products with very low margins, its high revenue may be less valuable than it appears.
Customer lifetime value
Some campaigns may attract customers who purchase once, while others may attract customers who remain with the business for years. A campaign with a higher acquisition cost may still be valuable if it attracts customers with stronger long-term value.
Attribution
Customers often interact with several marketing channels before purchasing. A customer might first see a Display advertisement, later visit through social media, and finally search on Google before completing the purchase. Giving all credit to the final channel may undervalue the earlier interactions.
Campaign scale
A successful campaign may not maintain the same performance when its budget is increased. Budget changes should therefore be tested gradually and monitored carefully.
Data quality
Campaign names, tracking links, conversion events, CRM records, and revenue data must be connected correctly. An analysis is only as reliable as the data used to create it.
The Real Role of a Marketing Analyst
A marketing analyst does more than calculate metrics or create dashboards. The analyst connects data from advertising platforms, websites, customer databases, and sales systems to answer business questions. The final report should not simply say: “Google Search had a ROAS of 7.0.” It should explain: “Google Search generated the strongest revenue performance and acquired customers at the lowest cost. I recommend increasing its budget gradually, maintaining Meta while improving lead quality, and reducing Display spending until stronger conversion performance is demonstrated.” The first statement reports a number. The second statement supports a decision. That difference is what turns marketing data into business value.
Final Thoughts
Marketing platforms provide large amounts of data, but more data does not automatically lead to better decisions. The most useful analysis follows the complete customer journey: Advertising spend → Clicks → Leads → Customers → Revenue → Profit. Clicks help us understand attention. Leads help us understand interest.
Customers and revenue help us understand business impact. The goal is not to find the campaign with the biggest numbers. The goal is to identify which marketing activities create meaningful and sustainable value for the business. That is the question I am learning to answer as I continue developing my career in marketing analytics.
A company recently spent $20,000 on digital advertising. The marketing team reported thousands of impressions, website visits, clicks, and leads. Every platform showed colorful dashboards and positive-looking numbers. But the business owner asked a much more important question: “Which campaigns actually worked, which ones wasted money, and where should we spend next month’s budget?” This is the type of question marketing analytics is designed to answer. Running advertisements is only one part of marketing. The more valuable skill is understanding what happened after the advertisements were launched and turning that information into a clear business decision.
The Problem With Looking at Clicks Alone
Many campaign reports focus on metrics such as impressions, reach, clicks, click-through rate, and cost per click. These metrics are useful because they show whether people noticed and interacted with an advertisement. However, they do not tell us whether the campaign generated valuable business results. A campaign can receive many clicks because the advertisement is interesting, but those visitors may never submit an enquiry or purchase anything. Another campaign may receive fewer clicks but attract people who are much more likely to become customers. That is why campaign performance should not be judged by one metric alone.
A Simple Campaign Scenario
Suppose a company divided its $20,000 advertising budget across three campaigns. The Meta Lead Generation campaign received $8,000. It generated 2,400 clicks, 240 leads, 24 customers, and $28,800 in revenue. The Google Search campaign received $7,000. It generated 1,400 clicks, 175 leads, 35 customers, and $49,000 in revenue. The Display Advertising campaign received $5,000. It generated 2,500 clicks, 100 leads, 5 customers, and $6,000 in revenue. At first glance, Display Advertising appears successful because it generated the highest number of clicks. But clicks are only the beginning of the customer journey. To understand which campaign truly worked, we need to connect advertising activity with leads, customers, and revenue.
Step 1: Calculate Cost per Click
Cost per click tells us how much the company paid for each website visit generated by an advertisement. Cost per click = Advertising spend ÷ Number of clicks. For Meta Lead Generation, the company spent $8,000 and received 2,400 clicks. The cost per click was approximately $3.33. For Google Search, the company spent $7,000 and received 1,400 clicks. The cost per click was $5.00. For Display Advertising, the company spent $5,000 and received 2,500 clicks. The cost per click was $2.00. Display Advertising produced the cheapest clicks. Does that make it the best campaign? Not necessarily. A cheap click is valuable only when the visitor takes a meaningful action.
Step 2: Calculate Cost per Lead
Cost per lead shows how much the company spent to generate one potential customer. Cost per lead = Advertising spend ÷ Number of leads. Meta Lead Generation produced leads at approximately $33.33 per lead. Google Search produced leads at $40 per lead. Display Advertising produced leads at $50 per lead. Meta generated leads at the lowest cost. At this stage, Meta appears to be performing better than Google Search. However, not every lead has the same value. Some leads may be highly interested, while others may submit a form and never respond again. We must therefore examine how many leads became paying customers.
Step 3: Evaluate Lead Quality
Lead-to-customer conversion rate shows the percentage of leads that eventually purchased. Lead-to-customer conversion rate = Customers ÷ Leads × 100. Meta converted 24 customers from 240 leads, giving it a conversion rate of 10%. Google Search converted 35 customers from 175 leads, giving it a conversion rate of 20%.
Display Advertising converted 5 customers from 100 leads, giving it a conversion rate of 5%. Google Search converted leads into customers at twice the rate of Meta.
This suggests that Google Search attracted people with stronger purchase intent. Someone searching for a product or service on Google may already be actively looking for a solution. A person scrolling through social media may be interested, but not yet ready to purchase. This is why lead volume should always be evaluated alongside lead quality.
Step 4: Calculate Customer Acquisition Cost
Customer acquisition cost tells us how much advertising money was required to acquire one paying customer. Customer acquisition cost = Advertising spend ÷ Number of customers. Meta spent approximately $333.33 to acquire each customer. Google Search spent $200 to acquire each customer. Display Advertising spent $1,000 to acquire each customer. Google Search produced the lowest customer acquisition cost.Although its clicks and leads were more expensive, those leads were much more likely to become customers. Display Advertising produced cheap traffic but very expensive customers. This is a good example of why optimizing only for
clicks can lead to the wrong business decision.
Step 5: Connect Campaigns to Revenue
The most important step is determining how much revenue each campaign generated compared with its advertising cost. Return on ad spend, commonly called ROAS, measures the revenue generated for every dollar spent on advertising. ROAS = Revenue ÷ Advertising spend Meta generated $28,800 in revenue from an $8,000 budget. Its ROAS was 3.6, meaning it produced $3.60 in revenue for every $1 spent. Google Search generated $49,000 in revenue from a $7,000 budget. Its ROAS was 7.0, meaning it produced $7 in revenue for every $1 spent. Display Advertising generated $6,000 in revenue from a $5,000 budget. Its ROAS was 1.2, meaning it produced only $1.20 in revenue for every $1 spent. Once product costs, employee costs, software expenses, and other operating costs are considered, the Display campaign may not be profitable at all.
Which Campaign Worked Best?
Google Search was the strongest campaign. Google Search generated the most customers, the highest revenue, the lowest customer acquisition cost, the highest lead-to-customer conversion rate, and the strongest return on ad spend. It did not produce the cheapest clicks or leads, but it produced the most valuable business results. Meta Lead Generation performed reasonably well. Meta generated the highest number of leads and maintained a positive return. However, its lead-to-customer conversion rate was lower than Google Search. This campaign should not necessarily be reduced immediately. Instead, the company should investigate whether better audience targeting, lead qualification, follow-up communication, or landing-page improvements could increase conversions.
Display Advertising underperformed
Display generated the most clicks and the lowest cost per click. However, it also produced the fewest customers, the highest customer acquisition cost, the lowest conversion rate, and the weakest return on ad spend. The campaign was successful at attracting traffic but unsuccessful at converting that traffic into business results.
How Should Next Month’s Budget Be Divided?
The company should not simply move the entire budget to Google Search. Campaign performance can change as spending increases. A campaign that performs well with a $7,000 budget may become less efficient if its budget is suddenly doubled. A more responsible recommendation would be to reallocate the budget gradually.
Google Search could receive $10,000, increasing its budget from $7,000 because it generated the strongest customer and revenue performance. Meta Lead Generation could continue with $8,000 while the company tests better targeting, lead qualification, and follow-up strategies. Display Advertising could be reduced from $5,000 to $2,000 and used mainly for retargeting, brand awareness, or controlled testing. The total monthly advertising budget would remain $20,000. This approach shifts more money toward the strongest campaign without completely stopping experimentation.
What I Would Investigate Before Making the Final Decision
The calculations provide an important starting point, but a complete marketing analysis should go deeper. Profit margin. Revenue is not the same as profit.
If one campaign generates sales for products with very low margins, its high revenue may be less valuable than it appears.
Customer lifetime value
Some campaigns may attract customers who purchase once, while others may attract customers who remain with the business for years. A campaign with a higher acquisition cost may still be valuable if it attracts customers with stronger long-term value.
Attribution
Customers often interact with several marketing channels before purchasing. A customer might first see a Display advertisement, later visit through social media, and finally search on Google before completing the purchase. Giving all credit to the final channel may undervalue the earlier interactions.
Campaign scale
A successful campaign may not maintain the same performance when its budget is increased. Budget changes should therefore be tested gradually and monitored carefully.
Data quality
Campaign names, tracking links, conversion events, CRM records, and revenue data must be connected correctly. An analysis is only as reliable as the data used to create it.
The Real Role of a Marketing Analyst
A marketing analyst does more than calculate metrics or create dashboards. The analyst connects data from advertising platforms, websites, customer databases, and sales systems to answer business questions. The final report should not simply say: “Google Search had a ROAS of 7.0.” It should explain: “Google Search generated the strongest revenue performance and acquired customers at the lowest cost. I recommend increasing its budget gradually, maintaining Meta while improving lead quality, and reducing Display spending until stronger conversion performance is demonstrated.” The first statement reports a number. The second statement supports a decision. That difference is what turns marketing data into business value.
Final Thoughts
Marketing platforms provide large amounts of data, but more data does not automatically lead to better decisions. The most useful analysis follows the complete customer journey: Advertising spend → Clicks → Leads → Customers → Revenue → Profit. Clicks help us understand attention. Leads help us understand interest.
Customers and revenue help us understand business impact. The goal is not to find the campaign with the biggest numbers. The goal is to identify which marketing activities create meaningful and sustainable value for the business. That is the question I am learning to answer as I continue developing my career in marketing analytics.